Gaming chairs now sit at the intersection of esports, PC gaming, streaming, and home-office ergonomics. The latest market estimates place the category in the low-single-digit billions globally, and most researchers still expect steady growth through the early 2030s.
gaming chair statistics
Key Gaming Chair Statistics
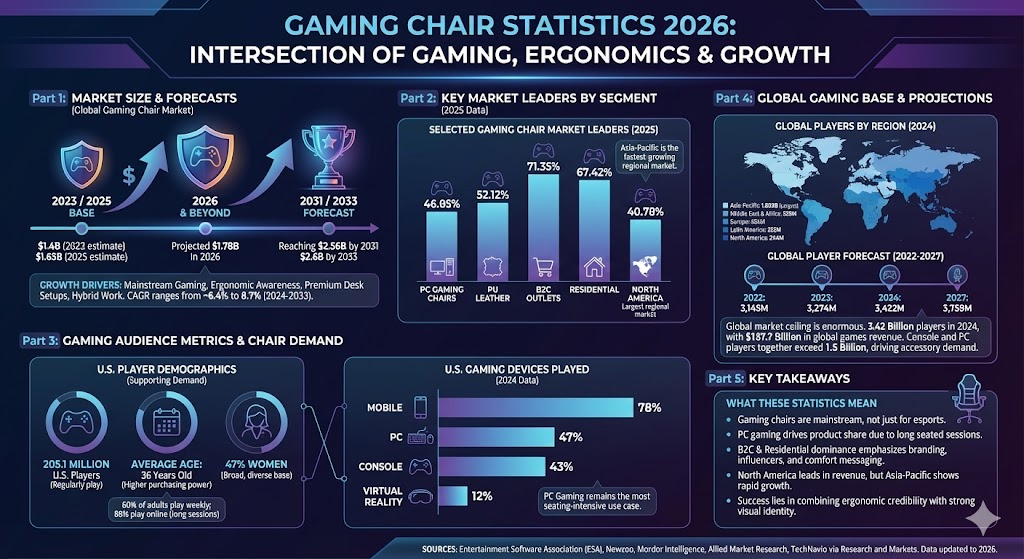
The global gaming chair market is estimated at $1.65 billion in 2025 and $1.78 billion in 2026, with a projected rise to $2.56 billion by 2031.
Another major forecast values the market at $1.4 billion in 2023 and projects it to reach $2.6 billion by 2033.
TechNavio estimates gaming chair revenue will increase by $582.1 million from 2024 to 2029, at a 8.7% CAGR.
North America is the largest regional gaming chair market in current industry estimates.
Asia-Pacific is the fastest-growing gaming chair market in Mordor Intelligence’s forecast.
PC gaming chairs held 46.05% of 2025 gaming chair revenue in one recent industry breakdown.
B2C outlets accounted for 71.35% of gaming chair revenue in 2025, while residential buyers represented 67.42%.
PU leather led materials with a 52.12% market share in 2025.
The U.S. has 205.1 million people who regularly play video games, and the average player age is 36.
Globally, Newzoo estimated 3.42 billion players in 2024, including 908 million PC players and 630 million console players.
Gaming Chair Market Size and Forecast
Research firms do not publish one identical market total, but they broadly agree on the direction of travel: gaming chairs are still expanding as gaming stays mainstream, ergonomic awareness rises, and premium desk setups become more common.
Source
Current or Base Figure
Forecast Figure
Growth Rate
Standout Takeaway
Mordor Intelligence
$1.65B in 2025
$2.56B in 2031
7.62% CAGR (2026-2031)
North America largest; Asia-Pacific fastest-growing
Allied Market Research
$1.4B in 2023
$2.6B in 2033
6.4% CAGR (2024-2033)
North America identified as the largest regional market
TechNavio / Research and Markets
Market adds $582.1M between 2024 and 2029
2029 value not stated in summary
8.7% CAGR
Health benefits, PC and console growth, and esports are named as core drivers
Selected gaming chair market leaders by segment (2025)
Label
Bar
Value
PC gaming chairs
46.05%
PU leather
52.12%
B2C outlets
71.35%
Residential
67.42%
North America
40.78%
Max = 71.35%. Widths: PC gaming chairs 64.54%, PU leather 73.05%, B2C outlets 100.00%, Residential 94.49%, North America 57.15%.
Gaming Audience Metrics That Support Chair Demand
Gaming chair demand is driven by a player base that is older, broader, and more mainstream than older stereotypes suggest. That matters because the more gaming overlaps with work-from-home setups, creator desks, and longer PC or console sessions, the more comfort and posture become purchase triggers.
U.S. player metric
Value
Why it matters for chair demand
Americans who regularly play video games
205.1 million
Gaming is a mass-market audience, not a small enthusiast niche
Adults who play every week
60%
Weekly use supports spending on comfort and desk upgrades
Average player age
36 years old
Older buyers usually have more purchasing power and ergonomic needs
Women among players
47%
The addressable buyer base is broad and diverse
Players who have played online
88%
Competitive, social, and long-session gaming remain common
U.S. gaming devices played among individual players (2024)
Label
Bar
Value
Mobile
78%
PC
47%
Console
43%
Virtual reality
12%
Max = 78%. Widths: Mobile 100.00%, PC 60.26%, Console 55.13%, Virtual reality 15.38%.
Global Gaming Base
The ceiling for gaming chair demand is much bigger than esports alone. Newzoo’s latest free market report put the worldwide player base at 3.42 billion in 2024, with continued growth expected through 2027. That means chair brands are selling into an enormous global entertainment market, even if only a fraction of players ever buy specialized seating.
Global gaming metric
Value
Why it matters
Global players in 2024
3.42 billion
Large audience base sustains accessory categories over time
Global paying gamers in 2024
1.50 billion
A large spending base helps support premium gaming hardware and furniture
Global games revenue in 2024
$187.7 billion
Gaming is big enough to support specialized equipment markets
PC players in 2024
908 million
PC gaming is the clearest seating-intensive use case
Console players in 2024
630 million
Console gaming still supports branded chair demand and living-room style products
Global players by region (2024)
Label
Bar
Value
Asia-Pacific
1,809M
Middle East & Africa
559M
Europe
454M
Latin America
355M
North America
244M
Max = 1,809M. Widths: Asia-Pacific 100.00%, Middle East & Africa 30.90%, Europe 25.10%, Latin America 19.62%, North America 13.49%.
The category is no longer a tiny esports side market. It is increasingly tied to mainstream gaming, creator setups, and desk-based leisure.
PC remains the most seating-intensive gaming use case, which helps explain why PC gaming chairs still lead product share in several industry estimates.
Residential and B2C dominance means branding, influencer visibility, comfort messaging, and direct online merchandising still matter more than enterprise sales.
North America remains the biggest revenue pool today, but long-run growth is likely to broaden with the global player base, especially in Asia-Pacific and other faster-growing regions.
The best-positioned chair brands are likely to combine ergonomic credibility, adjustable features, and strong visual identity rather than relying on racing-style looks alone.
Sources
Entertainment Software Association, Annual ESA Study Reveals Video Games’ Universal Appeal Across Generations, June 2025.
Entertainment Software Association, Essential Facts 2024.
Newzoo, Global Games Market Report 2024 free edition.
Mordor Intelligence, Gaming Chair Market Size and Share, updated January 2026.