The furniture market remains one of the largest consumer goods categories globally, supported by housing activity, renovation spending, hospitality demand, office upgrades, and the continued shift toward online shopping. Recent market data points to a large global revenue base, a residential-heavy mix, strong Asia Pacific leadership, and a fast-expanding online channel.
furniture market statistics
This article breaks down the latest furniture market statistics, including market size, growth outlook, segment mix, regional trends, e-commerce penetration, and recent U.S. retail sales figures.
Key Furniture Market Statistics
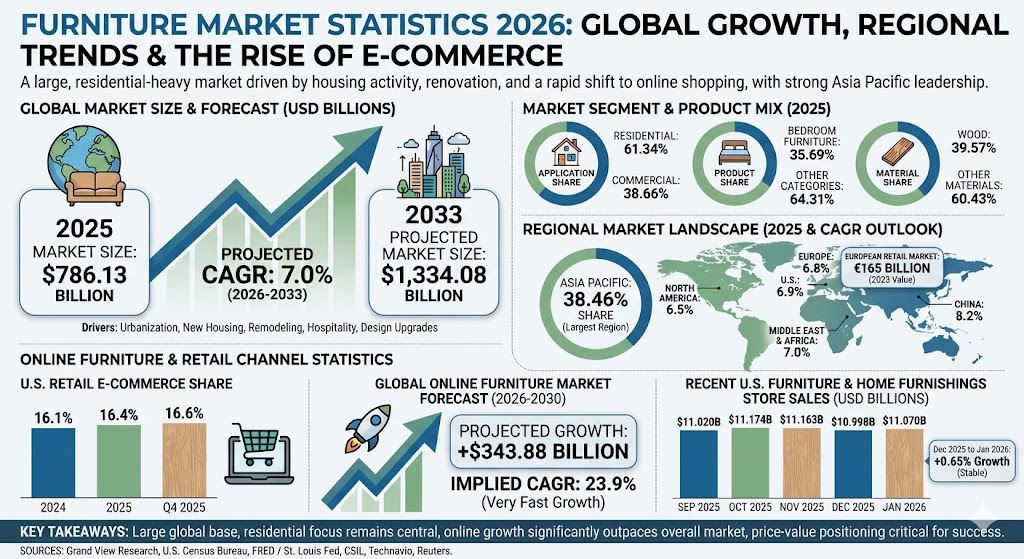
One recent estimate places the global furniture market at USD 786.13 billion in 2025.
That same estimate projects the market will reach USD 1,334.08 billion by 2033.
The implied forecast growth rate is 7.0% CAGR from 2026 to 2033.
Residential furniture accounted for 61.34% of the market in 2025.
Bedroom furniture held the largest product share at 35.69%.
Wood remained the leading material category with a 39.57% share.
Asia Pacific led all regions with a 38.46% market share in 2025.
The European retail furniture market was valued at EUR 165 billion.
In the U.S., e-commerce represented 16.4% of total retail sales in 2025 and 16.6% in Q4 2025.
U.S. furniture and home furnishings store sales reached USD 11.07 billion in January 2026.
The online furniture market is forecast to expand by USD 343.88 billion from 2026 to 2030.
That online segment forecast implies a very fast 23.9% CAGR.
Furniture Market Size and Growth Statistics
Current industry estimates still show a very large global base for furniture demand. One recent forecast puts the market at just over USD 786 billion in 2025, with a path to more than USD 1.33 trillion by 2033. That translates to roughly 69.70% cumulative growth between those two points.
For a broad market category, a 7.0% forecast CAGR is notable. It suggests the furniture industry is being lifted by structural drivers such as urbanization, new housing, remodeling, hospitality projects, and consumers upgrading living spaces with more design-led, modular, and multi-use products.
Furniture Segment Mix Statistics
The 2025 market mix shows that furniture demand is still led by the home. Residential spending dominates the category, while bedroom furniture leads the product split and wood remains the largest material type.
Application Share of the Furniture Market
Label
Bar
Value
Residential
61.34%
Commercial
38.66%
Max = 61.34%. Widths: Residential 100.00%, Commercial 63.03%.
Product Share of the Furniture Market
Label
Bar
Value
Bedroom furniture
35.69%
Other product categories
64.31%
Max = 64.31%. Widths: Bedroom furniture 55.50%, Other product categories 100.00%.
Material Share of the Furniture Market
Label
Bar
Value
Wood
39.57%
Other materials
60.43%
Max = 60.43%. Widths: Wood 65.48%, Other materials 100.00%.
The mix matters because it shows where scale already exists. Residential furniture is still the core of the market, but commercial demand is also meaningful and is supported by offices, hotels, restaurants, and public spaces. The bedroom lead reflects the size of bedding and mattress demand, while wood’s lead shows the durability of traditional materials despite rising use of plastic, metal, and engineered products.
Regional Furniture Market Statistics
Asia Pacific remains the largest region in the furniture market by share, and several regional growth rates remain healthy into the next forecast period. Europe is also still a major market in absolute terms, even after recent softness.
Regional Market Share
Label
Bar
Value
Asia Pacific
38.46%
Rest of world
61.54%
Max = 61.54%. Widths: Asia Pacific 62.50%, Rest of world 100.00%.
Selected Regional CAGR Outlook
Label
Bar
Value
China
8.2%
Middle East & Africa
7.0%
U.S.
6.9%
Europe
6.8%
North America
6.5%
Max = 8.2%. Widths: China 100.00%, Middle East & Africa 85.37%, U.S. 84.15%, Europe 82.93%, North America 79.27%.
Europe also remains a major market by value, with CSIL estimating the region’s retail furniture market at EUR 165 billion. At the same time, CSIL notes the market contracted 3.5% in 2023, showing that scale and short-term momentum do not always move in the same direction.
Online Furniture and Retail Channel Statistics
The furniture category continues to benefit from digital discovery, omnichannel merchandising, and easier delivery and financing options. The broader U.S. retail market is becoming more digital each year, and online furniture is forecast to grow much faster than the overall furniture market.
That broader e-commerce trend matters for furniture because consumers increasingly research dimensions, styles, finishes, reviews, and financing options online before purchasing. Technavio’s forecast that the online furniture market will add USD 343.88 billion from 2026 to 2030 at a 23.9% CAGR suggests digital-first furniture shopping is still gaining momentum much faster than the overall market.
U.S. Furniture Store Sales Statistics
Recent U.S. retail data shows that furniture and home furnishings store sales have remained fairly steady around the USD 11 billion monthly mark. January 2026 sales were slightly above December 2025, indicating a stable start to the year for the category.
Recent U.S. Furniture and Home Furnishings Store Sales
Label
Bar
Value
Sep 2025
USD 11.020 billion
Oct 2025
USD 11.174 billion
Nov 2025
USD 11.163 billion
Dec 2025
USD 10.998 billion
Jan 2026
USD 11.070 billion
Max = USD 11.174 billion. Widths: Sep 2025 98.62%, Oct 2025 100.00%, Nov 2025 99.90%, Dec 2025 98.42%, Jan 2026 99.07%.
From December 2025 to January 2026, sales rose by about 0.65%. That is not a breakout growth rate, but it does suggest the category stayed resilient even as consumers remained price conscious.
Competitive and Pricing Trends
Recent retailer commentary also points to a value-focused consumer environment. Reuters reported that IKEA cut prices by 10% on average over the last two years and still recorded a 1% decline in FY2025 retail sales to EUR 44.6 billion. Even so, the company said product volumes sold rose 3%, which suggests lower prices helped protect demand.
That dynamic is important for the wider furniture industry. It shows that market growth can coexist with margin pressure, promotions, and a more selective shopper. Brands that balance affordability, design, delivery speed, and omnichannel convenience are likely to perform best.
Conclusion
The latest furniture market statistics show a category with substantial global scale and a credible long-term growth outlook. Residential demand still drives the largest share of revenue, Asia Pacific remains the leading region, and digital commerce continues to reshape how consumers discover and buy furniture.
For businesses, the biggest takeaways are clear: the market is large, the home remains central, online growth is outpacing the broader category, and price-value positioning matters more than ever.
Sources
Grand View Research, Furniture Market Size, Share & Trends: https://www.grandviewresearch.com/industry-analysis/furniture-market
U.S. Census Bureau, Quarterly Retail E-Commerce Sales Report: https://www.census.gov/retail/ecommerce.html
FRED / U.S. Census Bureau, Advance Retail Sales: Furniture and Home Furnishings Stores (RSFHFS): https://fred.stlouisfed.org/series/RSFHFS
CSIL, European Furniture Market: https://www.csilmilano.com/european-furniture-market/
Reuters, IKEA sales fall for second year as retailer makes aggressive price-cutting push: https://www.reuters.com/business/retail-consumer/ikea-sales-fall-second-year-aggressive-price-cutting-push-2025-10-16/